DRAFTQA gate not approved — this report has not been signed off and must not be delivered to the customer in this state.Open QA gate ▸
CIVOPS MANUFACTURING SYSTEMS
CAPABILITY ASSESSMENT
Magnolia Automotive · Lebanon TN Assembly
automotive
large
3
1,250
ENG-AUTO-2026
patrick@civopssystems.io
8/5/2026
1.45
overall maturity (of 4)
MANAGED
CONFIDENTIAL · PREPARED FOR MAGNOLIA AUTOMOTIVE · LEBANON TN ASSEMBLY
01
Chapter 01
The opportunity
Where Magnolia Automotive · Lebanon TN Assembly stands today, where the next dollar of investment changes the curve, and how to move with confidence.
01
Executive summary
1.45
overall maturity
of 4 · managed
91%
capability coverage
43 of 47
$1.5M
annual ROI projected
if recommended uplifts adopted
4
capabilities at "initial"
primary investment targets
Magnolia Automotive · Lebanon TN Assembly sits at the managed stage of digital-manufacturing maturity. The largest opportunities are in standardizing data capture and connecting source-of-truth systems — typical of organizations whose Excel-and-tribal-knowledge phase is overdue for an upgrade. The path-forward emphasizes foundational instrumentation before analytics flourishes.
This assessment evaluated 47 capabilities across 12 dimensions against the CivOps maturity framework. Evidence was drawn from uploaded documents, system signals, and structured interviews.
Where Magnolia Automotive · Lebanon TN Assembly wins · where it lags · what closes the gap · how the platform pays for itself in year one.
Capital efficiency
$1.5M
annual return projected
If the recommended uplifts land, Magnolia captures multi-million-dollar annualized return inside Year 1.
The platform's ROI model decomposes this across six levers — efficiency, quality, downtime, cycle, cost-of-quality, and one residual. The sensitivity slide later in this deck shows the range.
Voice of the executive sponsor
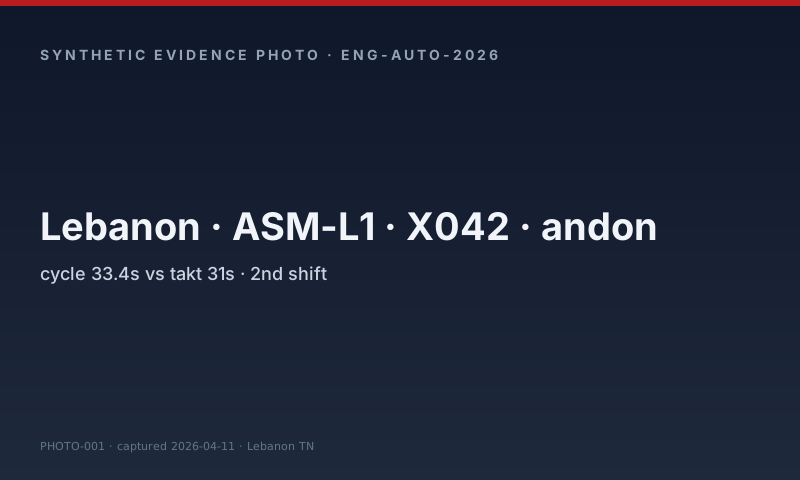
Bottleneck stations on L1 — X042 and X061 — are throttling the line, and the data we have is good enough to point at them but not good enough to fix them. We've been chasing this for 14 months.
— Marcus Whitfield
coo
02
Chapter 02
Where you stand
Capability scorecard against the 12-dimension framework, calibrated to your industry vertical and benchmarked against world-class peers.
Assessment validity
Every question is bound to a capability score
Validity is the closure between what we ask and what we score. Each instrument flows into the same 60-capability registry; coverage is auditable end-to-end.
Total questions
235
across 5 instruments
Capabilities backed by ≥ 1 question
42 / 47
89% of capability registry
Validity score
69%
question coverage × capability coverage
Instrument
Total questions
Bound to capabilities
Coverage
Visual
Detailed Systems Maturity
132
80
61%
Readiness Screening
20
19
95%
Lean Site Assessment
60
60
100%
Customer Discovery
20
20
100%
Workforce Voice Survey
3
3
100%
6 capabilities not yet bound to a question: rc.correlation · sf.incident_capture · sf.audits · sf.loto · wc.cash_to_cash · wc.eoq
Mean maturity per dimension. The polygon's shape tells the story: a balanced shape means broad foundation; a spiky shape means localized strengths and unaddressed gaps.
Maturity position map
Position vs your automotive peers
Three overlays on one radar: your current state (filled), peer median (dashed), world-class (dotted). Each dimension below shows where you sit relative to peers — color-coded by position, not by ranking.
0
Above world-class
0
Top quartile
1
Above peer median
0
At peer median
11
Below peer median
Per-dimension position
Income Management
Below peer median
Operational Output
Below peer median
Process Optimization
Below peer median
Working Capital
Below peer median
Quality
Below peer median
Root Cause
Below peer median
Maintenance
Above peer median
Safety
Below peer median
Supply Chain
Below peer median
Human Resources
Below peer median
Financial Data
Below peer median
Warehouse / Distribution
Below peer median
Tick marks on each track = peer 25th, median, 75th, world-class (p95). Filled marker = your position. No "Bottom Performer" ranking — manufacturing is multi-dimensional, peers vary.
Section 03
Dimension rollup — sorted by maturity
Each row sums every capability scored in that dimension
#
Dimension
Mean maturity
Top capability
Weakest capability
Maturity bar
1
Maintenance
2.25 / 4
Work-order discipline
Predictive maintenance
2
Safety
1.75 / 4
Audit cadence
LOTO discipline
3
Operational Output
1.71 / 4
Industrial connectivity
Changeover / SMED
4
Supply Chain
1.67 / 4
Inventory health
Demand forecast accuracy
5
Financial Data
1.67 / 4
Capitalized asset register
R&D tax-credit capture
6
Process Optimization
1.50 / 4
Bottleneck identification
Value-stream maps
7
Quality
1.33 / 4
Scrap cost Pareto by cause
SPC control charts
8
Warehouse / Distribution
1.33 / 4
Cycle count discipline
Fork-truck utilization
9
Human Resources
1.33 / 4
Training delivery + tracking
Engagement measurement
10
Working Capital
1.00 / 4
Inventory turns
EOQ optimization
11
Root Cause
0.75 / 4
Statistical outlier detection
Correlation analytics
12
Income Management
0.67 / 4
Cost-to-serve
Activity-based costing
Section 04
Capability landscape
Every capability mapped onto the 5-level maturity scale — heat shows where capabilities cluster
Capability landscape · how every capability maps onto the 5-level maturity scale
Each cell shows the count of capabilities whose maturity rolls up at that level. Heat tracks density.
Capability brief · QA
Quality
First-pass yield · statistical process control · cost of poor quality
Diagnose
5World-class
4Optimizing
3Measured
2Defined→
1ManagedNOW
0Initial
1.3
current
→ 2.3
12-mo target
Weakest capability
SPC control charts
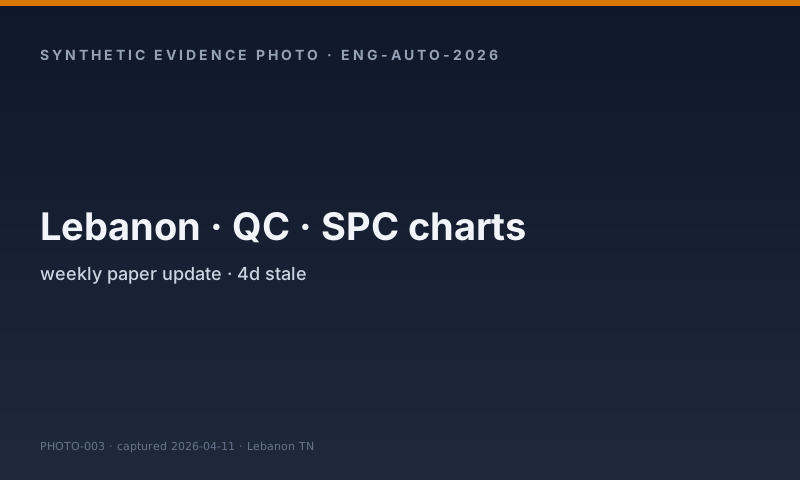
"Q1 SPC summary: X̄-R charts maintained on 4 critical-to-quality dimensions for the BIW frame weld station. Charts are updated weekly by a QA tech in Excel; out-of-control rules not formally enforced."
Decide
Recommended path: Quality is engineered into the process, not inspected at the gate.
""We track changeover time per SKU change, but the data lives in a clipboard the supervisor walks to maintenance. We have target times per product family — usually we hit ±15% without much analysis.""
Decide
Recommended path: Every machine, line, and shift contributes to a measurable, predictable output.
Preventive maintenance · mean time between failure · predictive readiness
Diagnose
5World-class
4Optimizing
3Measured→
2DefinedNOW
1Managed
0Initial
2.3
current
→ 3.0
12-mo target
Weakest capability
Predictive maintenance
""We do quarterly vibration spot-checks on the 30 most critical motors. We've talked about putting telemetry on them but the budget has been sitting in the queue for two years.""
Decide
Recommended path: Maintenance is condition-driven; the next failure is predicted, not discovered.
World-class signature
Preventive compliance ≥ 95% · breakdown rate down 30%+ year-over-year · documented predictive saves · Anheuser-Busch InBev, Chevron, Bridgestone Wilson
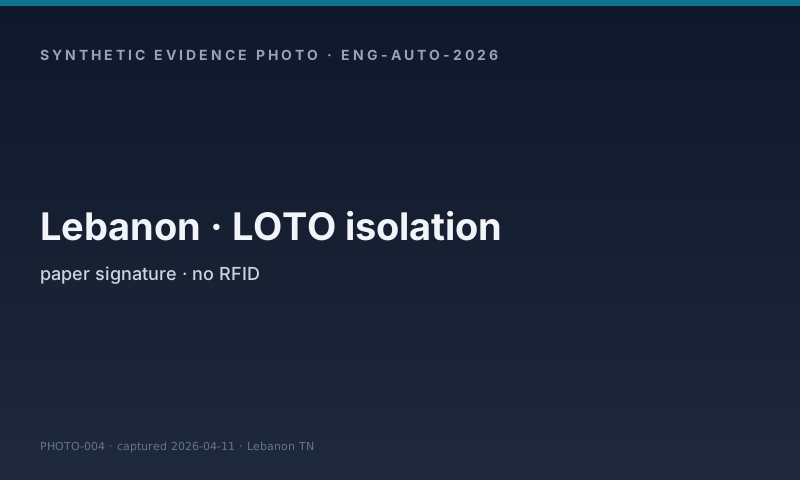
"LOTO procedures posted at every isolation point; signature sheets in use. Procedure docs live in DMS but execution is paper. RFID verification not deployed."
Decide
Recommended path: Safety is observable, real-time, and predictive; near-misses surface before incidents do.
World-class signature
Total recordable incident rate ≤ 0.8 · near-miss reporting rate ≥ 5× incidents · audit closure cycle ≤ 30 days · DuPont, ExxonMobil, Alcoa (legacy under O'Neill)
""Forecast comes from the customer EDI release schedule, plus a planner's gut. We don't measure forecast accuracy — once the customer commits, we just run it.""
Decide
Recommended path: Demand is forecast accurately, supply pulls match, and customer commitments hold under stress.
Where the platform amplifies what's already working
01
Safety · measured
Audit cadence
42% confidence · 1 evidence row
"Layered process audits run weekly per shift across all stations. Findings tracked in Intelex through closure with auto-evidence capture. Last IATF surveillance audit: 2 minor findings, both closed within 30 days." — document
02
Maintenance · measured
Work-order discipline
48% confidence · 1 evidence row
"Work orders tracked end-to-end with KPIs (backlog, prioritization, mean cycle). Backlog stable at 60-80 WOs · cycle time 4.3 days avg." — system
03
Maintenance · measured
PM compliance
48% confidence · 1 evidence row
"Maximo runs PM scheduling for 1,400 assets across the 3 plants. Q1 PM compliance: 91.2% (target 90%). Asset-class rollup available; auto-escalate runs nightly for overdue PMs." — system
04
Operational Output · defined
Industrial connectivity
48% confidence · 1 evidence row
"OPC UA / MQTT broker (HiveMQ) deployed at Lebanon. Plex ↔ FactoryTalk Historian via point-to-point mappings. ESB for ERP↔MES is on the roadmap but not deployed. ~60% of OT signals are unified through the broker; the rest are direct PLC reads." — system
05
Financial Data · defined
Capitalized asset register
40% confidence · 1 evidence row
"Capitalized asset register lives in Oracle. Reconciled with Maximo CMMS quarterly. Drift between the two is typically 1-2% per cycle." — system
05
Top weaknesses
Where the next dollar of investment moves the needle most
01
Root Cause · initial
Correlation analytics
0% confidence · 0 evidence rows
02
Working Capital · initial
EOQ optimization
0% confidence · 0 evidence rows
03
Warehouse / Distribution · initial
Fork-truck utilization
0% confidence · 0 evidence rows
04
Income Management · initial
Activity-based costing
0% confidence · 0 evidence rows
05
Quality · managed
SPC control charts
35% confidence · 1 evidence row
"Q1 SPC summary: X̄-R charts maintained on 4 critical-to-quality dimensions for the BIW frame weld station. Charts are updated weekly by a QA tech in Excel; out-of-control rules not formally enforced." — document
Voice of leadership
What we heard from your executives
12 pull-quotes · sourced from discovery interviews
"
Bottleneck stations on L1 — X042 and X061 — are throttling the line, and the data we have is good enough to point at them but not good enough to fix them. We've been chasing this for 14 months.
— Marcus Whitfield · coo
weakness
"
We need to be the platform supplier of choice for the next generation of EV body-in-white. That means OEE in the high 80s, FPY north of 99%, and a planning loop that closes inside one shift.
— Marcus Whitfield · coo
opportunity
"
Our deviation cycle time is 11 days average. That's 11 days where we're shipping product without a closed-out root cause. The customer notices.
— Andrea Caldwell · vp-quality
risk
"
Statistical outlier detection. If the system flagged the top-2 anomalies on every line every shift, my team's day would be transformed.
— Andrea Caldwell · vp-quality
opportunity
"
I spend three hours a day in spreadsheets. The data is in Plex but my supervisors and I rebuild the same view manually every morning.
— Tomas Reyes · operations-director
weakness
"
Big changes work when the supervisor network is bought in early. Other times we've had top-down rollouts that stalled at 50% adoption.
— Tomas Reyes · operations-director
concern
03
Chapter 03
Risk and governance
Compliance posture, implementation risks, accountability and the cadence that keeps the engagement on track.
Customer's own controls reviewed alongside CivOps's SOC 2 readiness pack.
Risk register
Implementation risks · mitigations · owners
8 risks · ranked by heat (likelihood × impact)
Risk
Category
Heat
Likelihood
Impact
Mitigation
Owner
Data-fabric ownership gap stalls cross-system value
CIO confirmed Plex / FactoryTalk / Snowflake are unconnected. Without a unified semantic layer, cross-domain analytics (scrap ↔ cost-to-serve ↔ OTIF) stays manual.
data
80
almost-certain
major
Phase 1 deliverable: stand up CivOps data fabric across Plex, FactoryTalk, Snowflake, Maximo, Cornerstone. Named owner: IT/OT lead (TBD by Owen Brennan within 2 weeks of kickoff).
Owen Brennan · CIO
Tier-1 customer EDI continuity during cutover
Nissan CMMS3 / Toyota TMC / Stellantis Power penalize an EDI gap. Cutover without dual-write window risks chargebacks; Stellantis is already at 92.1% OTIF (below 94% chargeback threshold).
supplier
64
likely
major
Replacement-ladder dual-write pattern (passive_read → shadow_write → dual_write → primary). Hold dual_write for 14 days minimum. Stellantis paint-batch sequencing fix lands in Phase 1.
Veronica Stinson · VP Supply Chain
Bottleneck stations X042 + X061 cap Year-1 ROI
Door-aperture (X042) and rear-quarter weld (X061) consistently 2-3s over takt. Without rebalance, OEE upside on L1 is capped at ~3% regardless of platform deployment.
process
64
likely
major
Phase 1 includes a SMED + rebalance kaizen led by the production team using the platform's bottleneck-id auto-Pareto. Target: cycle ≤ 31.5s by week 6.
Tomas Reyes · Production Manager
Change-management drag at 1,250 headcount
Multi-shift, multi-site rollouts depend on supervisor enrollment + structured 30/60/90 cadence. Without a champion network, adoption stalls at 40-50% based on the production manager's prior-rollout testimony.
people
64
likely
major
RACI-driven champion network (~25 supervisors) · weekly steerco · adoption KPI on the platform's value-attribution ledger. HR director (Rosa de Guzman) is co-owner.
Marcus Whitfield · COO (sponsor)
IATF 16949 audit posture during transition
Process changes during instrumentation cutover require a layered process audit refresh. An interim period without consistent records creates audit risk at the next surveillance audit (Q3-2026).
regulatory
48
possible
major
Pre-stage audit artifacts in the CivOps compliance pack · maintain dual-record period for 30 days · IATF lead auditor (Tomas Reyes) reviews evidence weekly during cutover.
Andrea Caldwell · VP Quality
Line-balance disturbance during deployment
Walk-through-balanced lines (92 stations · 31s takt) lose ~2-3% throughput during instrumented cutover unless rebalanced. Bottlenecks already at X042 / X061; instrumentation may extend cycle by 0.4-0.6s.
process
36
possible
moderate
Run pre-cutover line-balance simulation in the CivOps flow engine · rebalance bottleneck stations BEFORE instrumenting · operators trained on the new HMI before live data goes through.
Tomas Reyes · Production Manager
Statistical outlier engine adoption resistance
QA team is spreadsheet-driven and skeptical of automated anomaly detection. Without trust-building, the auto-flag becomes noise that gets ignored.
people
36
possible
moderate
Run shadow-mode for 4 weeks (alerts captured but not auto-routed). Compare to QA team's findings. Switch to live mode only after agreement on signal quality.
Andrea Caldwell · VP Quality
$6M Capex envelope discipline
CFO has $6M committed for 2026 digital ops. Scope creep past the SOW erodes payback math; CFO won't approve scope changes without business case re-validation.
financial
36
possible
moderate
Scope-change is a change-order with refreshed payback model. Monthly business review with CFO is the gate.
Concrete week-by-week deployment plan tailored to Magnolia Automotive · Lebanon TN Assembly's three weakest capability areas
Week 1
Stand up the operations cadence
Monday
Engagement-lead + plant-manager kickoff — walk the engagement scorecard together · agree the 3 dimensions we'll push first.
Tuesday
Provision the platform tenant for Magnolia Automotive · Lebanon TN Assembly (mode flip from assessment → live) · supervisors get login emails by end of day.
Wednesday
First operator group at the kiosk · daily start-of-shift huddle migrates from clipboards to the platform's SQDIP board.
Thursday
Focus area #1 · Correlation analytics: pull the relevant tags from your historian + name the daily owner.
Friday
First weekly review with the executive sponsor — five-slide deck pulled directly from the platform, no PowerPoint hand-build.
Week 2
Instrument the floor
Monday
OT-network read of the first PLC — Ignition / OPC UA / MQTT connector verified · first tag streaming to the fabric.
Tuesday
Focus area #2 · EOQ optimization: stand up the first per-shift roll-up dashboard.
Wednesday
Layered process audits — replace paper rounds with the platform's mobile audit flow · first supervisor's audit goes live.
Thursday
Maintenance backlog: top-25 open work orders imported · PM compliance baseline locked.
Friday
Second weekly review — leadership sees actual customer data on the SQDIP board, not screenshots from a slide deck.
Week 3
Voice + visibility
Monday
Focus area #3 · Fork-truck utilization: stand up the first capability scorecard.
Tuesday
Quality: first deviation flowed end-to-end inside the platform · CAPA bound to the deviation · audit trail visible to the QA lead.
Wednesday
Stakeholder survey results review — silo divergence + perceptual gaps presented to the leadership team.
Thursday
First Force-OT pass (workforce optimizer) — the platform proposes the next coverage move; supervisor confirms; everyone sees the rationale.
Friday
Third weekly review — first dollar-sized loss area surfaced from the customer's actual data.
Week 4
Lock in the loop
Monday
Layered audits running on every shift · daily action board surfaces the top-3 things to look at first.
Tuesday
First closed-loop CAPA — deviation → root-cause → corrective action → effectiveness verification — all inside the platform.
Wednesday
Calibration + training schedules pulled into the platform · expiry alerts active.
Thursday
Executive sponsor walkthrough of the live Master Control Center — what changed in 30 days · what changes next.
Friday
Phase-1 retrospective: which 3 dimensions moved fastest · which need a different intervention · what does Phase-2 commit to.
This is the plant-manager's pocket plan — concrete enough to walk into the first shift meeting and tell every supervisor exactly where their day starts. Each step ties back to the engagement scorecard's prioritized dimensions; nothing on this slide is generic.
Connectivity
Digital subsystems · vendor map · driver readiness
Every business and operational system in scope — current vendor, utilization, support model, migration plan, and the CivOps adapter that connects it on Day-1.
→ Standardize on one BI platform under platform deployment
2026-09-01
tableau
Owen Brennan
2 systems planned · driver pre-allocation reserved.
Readiness screening
Voice of customer · current system · current technology
Each focus area scored on three axes (1=low / 5=mid / 10=high). High voice-of-customer paired with low system or tech = where investment moves the needle most.
Voice of customer (VOC)
How critical this is to the business and customer
Current system
How well the business process / system supports the need
Current technology
How well the deployed tech enables the process
#
Focus area
VOC
System
Tech
Gap
Notes
7
Supply Chain
Strategy
10
5
1
+9
Lot traceability exists for IATF audit but is reactive — no real-time genealogy.
13
Manufacturing / Lean / Value Stream
Process / Infrastructure
10
1
5
+9
Layout reasonable but takt mis-balance at X042 / X061. No time-study program.
14
Performance & Quality Management
Process / Infrastructure
10
5
1
+9
Performance data is late + manual. No real-time visibility for plant managers.
1
Accounting / Scheduling
Business Systems
10
5
5
+5
Plex is well-implemented but not integrated to MES/SCADA. Big add-on opportunity
3
Reporting
Business Systems
5
1
1
+4
11 BI tools; no self-service for plant managers. Critical gap.
5
Manufacturing / Lean / Value Stream
Strategy
5
5
1
+4
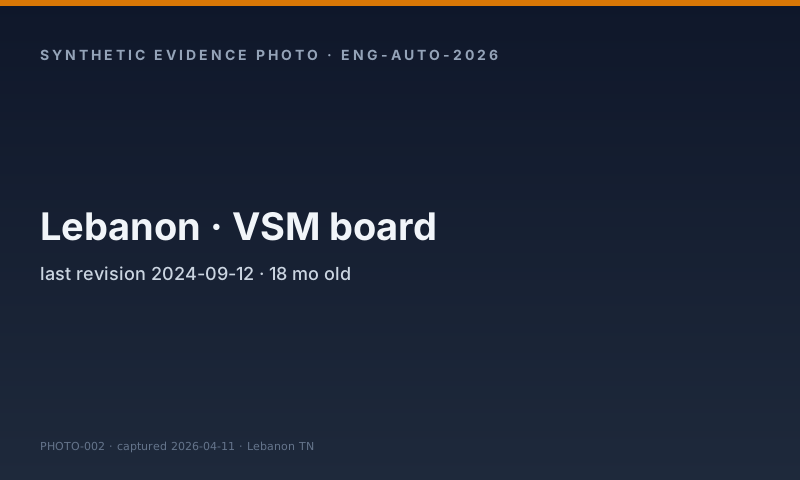
Strategic VSM dated 2024; not refreshed in 18 months. No data-driven VSM.
6
Quality & Project Management
Strategy
5
1
1
+4
Quality is mostly manual. ETQ for CAPA; no formal QMS-to-line linkage.
10
Supply Chain
Process / Infrastructure
5
1
5
+4
Inventory tracked at category level. WIP not real-time. Auto-reorder on fastener
15
Accounting / Scheduling
Operations
5
1
1
+4
Scheduling reactive to OEM EDI. Stellantis paint-batch sequencing causes OTIF ga
18
Performance & Quality Management, Lean
Operations
5
1
5
+4
Vision systems on weld cells; poke-yoke on a subset of stations.
20
Maintenance
Operations
5
1
1
+4
Reactive maintenance dominates. No PdM program; vibration spot-checks only.
2
IT / Cybersecurity
Business Systems
5
10
5
+0
OT/IT separation in place; firewall + MFA. CISO-led program.
4
Mgmt.
Strategy
5
5
5
+0
Marcus Whitfield is an active exec sponsor. $6M committed.
HIGHEST: Increase Throughput. SECOND: Reduce Cost. LOWER: Increase Sustainability, Improve Quality (already a top quartile), Increase Flexibility (mid-priority).
"Blank check" — what they'd invest in
Real-time data fabric across Plex / FactoryTalk / Maximo / Snowflake + statistical outlier engine on every line every shift + bottleneck-resolution playbook auto-pushed to supervisors. Replaces ~3 hours/day of supervisor spreadsheet wrangling.
Top pain areas surfaced by the workforce
1) X042 + X061 bottlenecks on L1 (14 months chasing). 2) 11-day deviation cycle (Andrea). 3) 11 BI tools no self-service (Owen). 4) Stellantis OTIF chargeback exposure (Veronica). 5) PM compliance up but breakdown rate flat (Devon).
3 individual stakeholder survey responses captured · Marcus Whitfield (COO) · Andrea Caldwell (VP Quality) · Owen Brennan (CIO)
Process map
Suppliers · Inputs · Process · Outputs · Customers
End-to-end value-stream context grounded in the customer's own description of their operation.
X042 (door-aperture weld) · X061 (rear-quarter weld) · paint-batch sequencing handoff at Decatur. These are the candidates for Khenda-style time studies.
Engagement qualifier
Fit criteria score · pre-visit posture
The 10-criterion fit score gates whether the engagement is ready to proceed; the pre-visit checklist confirms what the customer sent before kickoff.
Fit total
37/ 46
GOOD FIT
80% of best-possible · band: <20 caution · 20-29 hesitate · 30-40 good · 40+ ideal
Capability moves toward the world-class signature through a curated solution stack. Detailed implementation plan finalized during Phase-1 kickoff.
Success metric: Capability moves from current level to 'measured' as documented in the engagement scorecard.
Effort
standard
Time-to-value
1-2 quarters
Impact band
$150K-$500K/yr
Partner stack (0)
Warehouse / Distribution · Phase 2 · Instrument
Fork-truck utilization
Capability uplift program
Capability moves toward the world-class signature through a curated solution stack. Detailed implementation plan finalized during Phase-1 kickoff.
Success metric: Capability moves from current level to 'measured' as documented in the engagement scorecard.
Effort
standard
Time-to-value
1-2 quarters
Impact band
$150K-$500K/yr
Partner stack (0)
Income Management · Phase 2 · Instrument
Activity-based costing
Capability uplift program
Capability moves toward the world-class signature through a curated solution stack. Detailed implementation plan finalized during Phase-1 kickoff.
Success metric: Capability moves from current level to 'measured' as documented in the engagement scorecard.
Effort
standard
Time-to-value
1-2 quarters
Impact band
$150K-$500K/yr
Partner stack (0)
Quality · Phase 1 · Stabilize
SPC control charts
Statistical Process Control Engine · with anomaly routing
Replace paper / Excel charts with continuous X̄-R, exponentially-weighted moving average, and Western-Electric rules computed from the historian. Out-of-control signals route to the right operator within 60 seconds with a triage card.
Success metric: Time-to-detect of an out-of-control event drops from hours to minutes; documented response on every signal.
140 curated partners across 30 categories · CivOps-native, aligned, preferred adapters, and commercial alternatives
2
CivOps-native
6
CivOps-aligned
31
Preferred adapters
95
Commercial alternatives
6
Open-source
ops intelligence
172n4a
erp
133p
mes
124p
vision
121p
bi analytics
101n2p
cmms
82p
plc hmi
82p
rca quality ai
71a
esb ipaas
71a1p
robots cobots
72p
ot cyber
71p
scada
61a3p
no code mfg apps
61a
pdm
61a
data warehouse
62p
historian
51a4p
andon
5
hris
51p
CivOps-native = built into the platform · Aligned = strategic integration partner · Preferred = drop-in adapter · Commercial = known alternative customers consider · OSS = open-source path. The platform delivers the bundled outcome at one price; the alternatives column is honest disclosure.
Partner deep dive
Curated technology partners · category by category
Where CivOps has direct integrations, where it amplifies an aligned partner, and where it displaces a commercial alternative.
platform suite 2 partners
CivOps Manufacturing PlatformCivOps Digital Framework for Operations
ops intelligence 17 partners
CivOps Manufacturing PlatformCivOps Digital Framework for OperationsThinkIQHighByte Intelligence HubInductive IgnitionSurgereMachineMetrics+10 more
140 partners total across 30 categories. Color-coded by CivOps relationship: cyan = native, light cyan = aligned, green = preferred adapter, amber = commercial alternative, slate = open-source. Hover any chip in the live deck for the partner's "best for" line.
Alternatives
Commercial alternatives by gap
What you'd evaluate buying separately if not for the platform — honest disclosure
Each row is one capability gap with the curated commercial + CivOps-aligned candidates a customer would otherwise evaluate. The platform delivers the same outcome bundled — one license, one data layer, one report.
05
Chapter 05
Investment and economics
Cost-of-poor-quality decomposition, return decomposition, sensitivity range and Year-1 economics.
Cost of poor quality
Where the dollars actually go
Magnolia Automotive · Lebanon TN Assembly's revenue is eroded by six identifiable loss areas before it lands as realized contribution
Annual revenue · loss decomposition · realized contribution
Each subtraction is a measurable, addressable loss area. The platform makes every loss visible, attributable, and actionable — closing the gap between revenue and realized contribution is what the path-forward roadmap is engineered for.
07
ROI projection — annual
Coarse model · 3 facilities · automotive
$1,546,404 per year
OEE uplift
$463,921
Scrap reduction
$340,209
Downtime → PdM
$278,353
Cycle / takt fit
$216,497
Cost-of-quality
$154,640
Other
$92,784
Lever shares are illustrative typical-customer splits; actual breakdown converges as system data lights up. This figure excludes one-time stabilization gains and avoided customer-loss events. Maximum lever bar = $1,546,404.
Sensitivity
Return-on-investment tornado
Each lever's range from worst-case to best-case · ranked by spread
Return-on-investment sensitivity · lever-by-lever
Levers near the top have the widest sensitivity — they're where execution discipline matters most. The CFO's defense of the business case lives in the spread.
ROI sensitivity
Best case · likely case · worst case
What changes between cases — and what you can do about it
Worst case
$992,002
payback: 6mo
Adoption stalls at supervisor level; only OEE-uplift and scrap levers carry through. Downtime/PdM benefits realize in Year 2 instead of Year 1.
Likely case
$1,546,404
payback: 4mo
Phase-1 stabilizes the foundation; Phase-2 instrumentation lights up the ROI levers as planned. Adoption hits the 60-70% target by Q2.
Best case
$2,525,245
payback: 3mo
Strong executive sponsorship + champion network drives 80%+ adoption. Predictive maintenance lights up early; Cost-of-Quality and OEE levers compound.
Lever
Low (×)
High (×)
Low ($)
High ($)
OEE uplift
0.60
1.40
$278,353
$649,490
Scrap reduction
0.50
1.50
$170,104
$510,313
Downtime → PdM
0.50
1.40
$139,176
$389,694
Cycle / takt fit
0.70
1.30
$151,548
$281,446
Cost-of-quality
0.60
1.40
$92,784
$216,497
Other
0.70
1.30
$64,949
$120,620
Cash-flow
36-month cumulative cash position · worst / likely / best fan
Adoption stalls at supervisor level; only OEE-uplift and scrap levers carry through. Downtime/PdM benefits realize in Year 2 instead of Year 1.
Likely case
$1.55M / yr
Payback: 8 months
Phase-1 stabilizes the foundation; Phase-2 instrumentation lights up the ROI levers as planned. Adoption hits the 60-70% target by Q2.
Best case
$2.53M / yr
Payback: 7 months
Strong executive sponsorship + champion network drives 80%+ adoption. Predictive maintenance lights up early; Cost-of-Quality and OEE levers compound.
Cost ramp loads ~60% of Year-1 spend into the first nine months. Benefit ramp starts at month 3 (stabilization complete) and reaches monthly run-rate by month 9. The shaded band shows the worst-case-to-best-case envelope; the solid line is the likely-case curve. Payback marks the month each scenario crosses break-even.
08
Implementation timeline
From kickoff to optimization · Magnolia Automotive · Lebanon TN Assembly
W0
W4
W8
W12
W16
W20
W24
W28
W32
W36
Engagement kickoff
1w
Document + interview cycle
3w
System connections
4w
Capability scoring + report
2w
Phase 1 deployment
6w
Phase 2 instrument
10w
Phase 3 optimize
12w
38-week program · 12 weeks to first measurable uplift · 26 weeks to optimization phase.
09
Investment summary
Year-one economics · MODELED estimates, not a quoted price
⚠ Modeled — not a quoteThe numbers on this slide are derived from the engagement's headcount + facility count + maturity score. They are a sizing model the customer can use to scope the conversation, not a SOW price. The final figure lives in the engagement's commercial proposal; this slide is illustrative only.
Total year-1 investment
$530,000
Platform license: ~$340,000
Implementation: ~$140,000
Training + change mgmt: ~$50,000
Year-1 annualized return
$1,546,404
OEE / throughput uplift
Scrap + COPQ reduction
Avoided downtime via PdM
Working-capital release
Payback period
4 months
3049K cumulative 3-yr surplus
Excludes one-time savings
Excludes risk-avoidance
CFO pak
One page · drop into the IC deck
Modeled economics digested for the CFO + IC review · single page · paste-and-go
Year-1 investment
$530,000
Platform license + implementation + change-management. Modeled, not quoted — the SOW lands the binding figure.
For investment-committee use only. Every number on this page is a model based on the engagement scorecard + headcount + footprint. The binding price + scope lives in the engagement's SOW — confirm against that before any commitment.
10
Next steps
What we recommend in the next 14 days
Executive review (this week) · Walk this report with the executive sponsor; align on the path-forward priorities.
Convert to platform (week 2-3) · The same tenant retains all evidence + scorecard and becomes the customer's first platform tenant on conversion. No data migration; just a mode flip.
Phase 1 kickoff (week 3) · Begin Stabilize phase with the prioritized initiatives.